
If you have ever struggled with evaluating the impact that a change to your website has made, was performance improved, or has it degraded, then look no further.
Last week we looked at the Performance and Activity Heatmap, which gives a great overall view of how your site is performing across the week. The next report that I wanted to take a brief look at is the Comparison Report.
As is indicated by the name, this report allows you to make comparisons between the performance of a website, for two time periods Typically you may want to look at your production site, selecting time periods before and after, a change that you made. This allows you to see very quickly the impact that the change has had. Or alternatively you may, for example, have run a load test of a new release, and want to compare the performance of the new version in a test environment, against the current version in production.
You can do both of these, and more, using this report.
When opening the report you have an initial selector for the two time periods that you wish to compare. In addition you can specify the domain, or domain group. So you could choose the same domain with different periods, or different domains of course. You also have a filter selection, to slice up the results for finer comparison.
Running the report give you 3 views of the relative performance. In all of these, the results are colour-coded, green for an increase in users, or views and reduction in response time and red for the opposite.
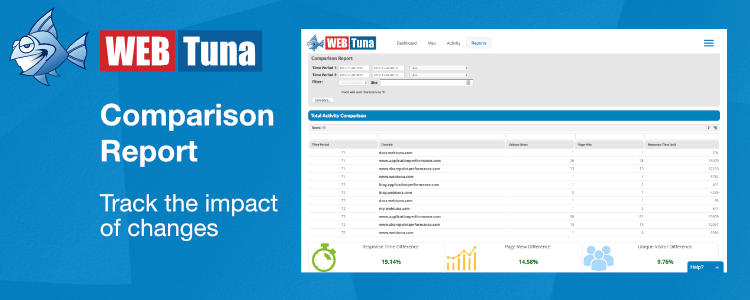
Total Activity Comparison
This section gives some overall information, number of users, page views, and average response time for the two periods, and then three relative metrics.

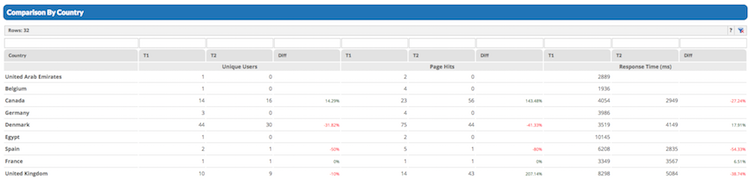
Comparison By Country
The second comparison is looking at how the two time periods compare by country, and like all WebTuna tables, can be re-sorted by clicking on the column heading and filtered by entering a filter string as described in this article on WebTuna advanced filtering.
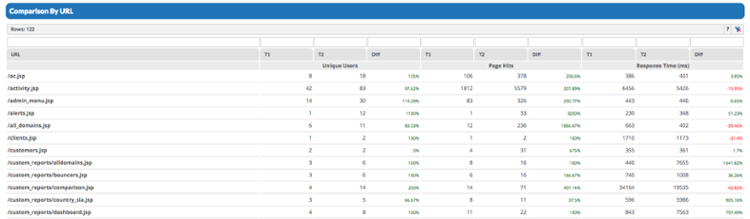
Comparison By URL
The last view is a list of pages; for each there are three sections of data: unique users, page views, and response time, with the values for each of the two time periods, and the percentage change across the two periods. As with the country comparison, this can be re-sorted and filtered in the usual way, for example to rank the page with the largest change in response time first.
If you’ve never looked at this report, why not check it out occasionally – it’s great for checking performance before implementing changes into production. Or if you are new to WebTuna, why not signup for a 15 day free trial.