WebTuna has a Power BI content pack to allow users to visualize and interact with WebTuna usage and performance data in new ways. It pulls detailed data daily for the previous day...
The data provided by Real User Monitoring (RUM) and Web Analytics often crossover and sometimes there is confusion about whether you need one or the other or both. Quite often...
Your REST API key can be generated on the Change Password screen under Admin. You can generate a new API key from here any time if you think your API key...
If the web application you are monitoring has multiple frontend web servers and you would like to see performance broken down by servername then you can have the webtuna.js capture...
If you are using Confluence from Atlassian for team collaboration and need to monitor the real end user experience that is being delivered to all of your end users then WebTuna can...
If the web application you are monitoring requires a login and you would like to be able to track performance down to an individual user then you can have the...
Several metrics are collected from the DOM (Document Object Model) of the users browser when the window.onload event fires. This is after the page has already loaded so it will...
WebTuna simply requires a small JavaScript file (webtuna.js) to be included on your pages. This JavaScript collects all the key performance and analytic metrics and asynchronously sends them to the...
WebTuna uses a small (5K) piece of JavaScript which you need to place into you site template in order to monitor your site. This JavaScript file is called webtuna.js.
WebTuna has a Power BI content pack to allow users to visualize and interact with WebTuna usage and performance data in new ways. It pulls detailed data daily for the previous day...
If the web application you are monitoring has multiple frontend web servers and you would like to see performance broken down by servername then you can have the webtuna.js capture...
If you are using Confluence from Atlassian for team collaboration and need to monitor the real end user experience that is being delivered to all of your end users then WebTuna can...
If the web application you are monitoring requires a login and you would like to be able to track performance down to an individual user then you can have the...
WebTuna simply requires a small JavaScript file (webtuna.js) to be included on your pages. This JavaScript collects all the key performance and analytic metrics and asynchronously sends them to the...
WebTuna uses a small (5K) piece of JavaScript which you need to place into you site template in order to monitor your site. This JavaScript file is called webtuna.js.
Dear Customers and Partners, we want to take a moment to share with you the approach that we are taking to support our staff, customers, partners, and community during this...
Last year we made the decision to move both our blogs (blog.applicationperformance.com and blog.webtuna.com) to a Jekyll generated static site. Static sites are in fashion right now because they are...
It has been a little while since our last release, and our new release now collects all the resource timing information that modern browsers provide. This includes images, style-sheets etc,...
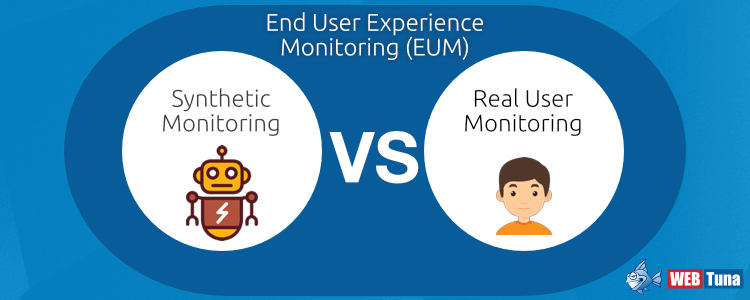
When you start looking into web performance and monitoring, you are bound to come across several words and acronyms; EUM (End User Monitoring), Synthetic Monitoring and RUM (Real User Monitoring)....
We hope that you liked our recent Conversion Funnel report, which we launched a short while ago. Here’s an overview of further changes which have just been released.
We hope that you liked our revamp of the geomap, which we launched about 3 weeks ago. Here’s a preview of further changes which should be released in the next...
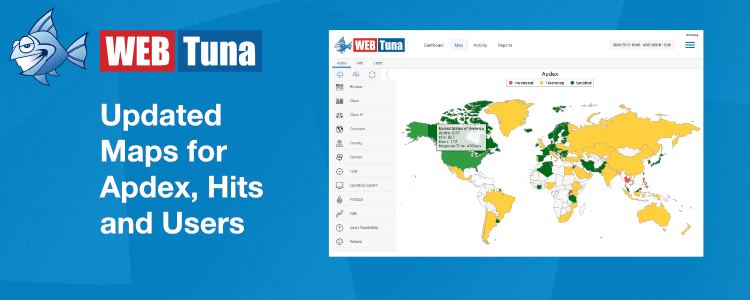
Today we released an updated Map screen with new functionality. We think you will love it. It has a cleaner style and you can now filter what is displayed on...
At WebTuna we always love to integrate our solution with others as it adds value to customers. Recently we worked with the Dutch company Ymor, whose Ymonitor service gives customers...
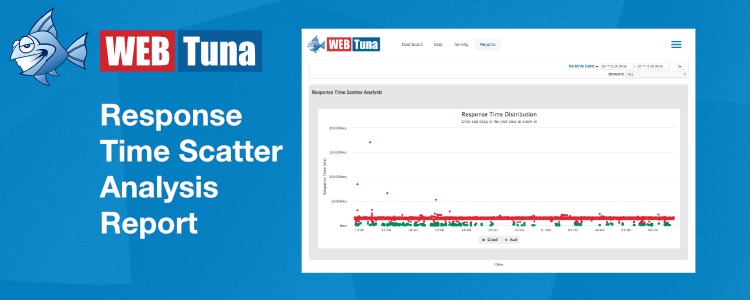
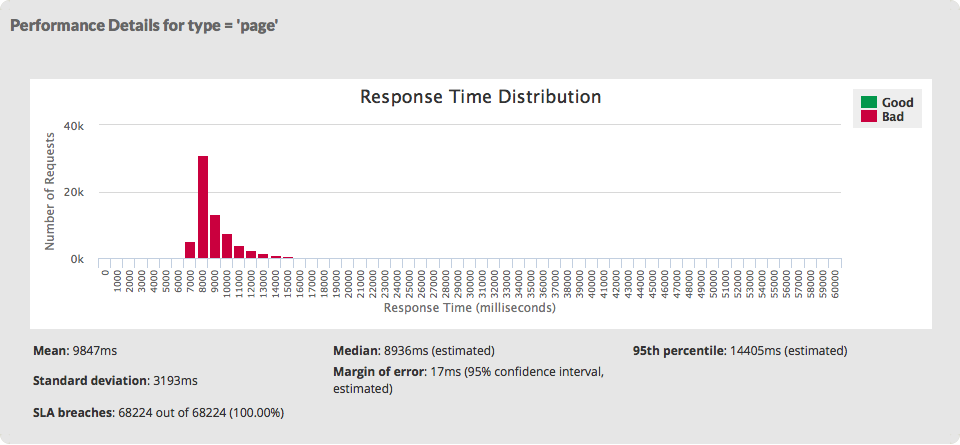
Do you want a quick pictorial overview of how your site is performing? The WebTuna Response Time Scatter Analysis report lets you see your site response time distributions over time.
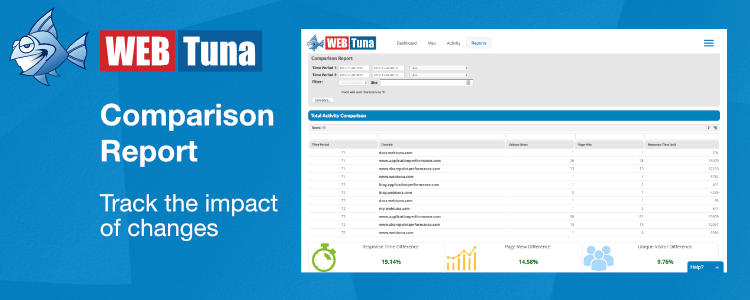
If you have ever struggled with evaluating the impact that a change to your website has made, was performance improved, or has it degraded, then look no further.
How well do you know your way around WebTuna? In conversation with our customers we often hear them tell us, ”I didn’t know that you could do that in WebTuna”.
We are are pleased to announce that WebTuna now has conversion funnel reporting. This new report is available to all customers and lets you track the number of sessions that got...
We are are pleased to announce that WebTuna now has built-in alerting for all customers who need to be notified when performance of their web site goes bad. This has...
Ricardo is a global, strategic engineering and environmental agency, with more than 3000 employees, that specialises in transport, energy and scarce-resource sectors.
If you have ever used WebTuna then you will know that we try to colour-code the performance data using a fairly standard red-amber-green (RAG) model. Red indicates poor performance and...
Many customers like to extract WebTuna data to further process it with Microsoft Excel. There are a number of different ways to get data out of WebTuna and into Excel...
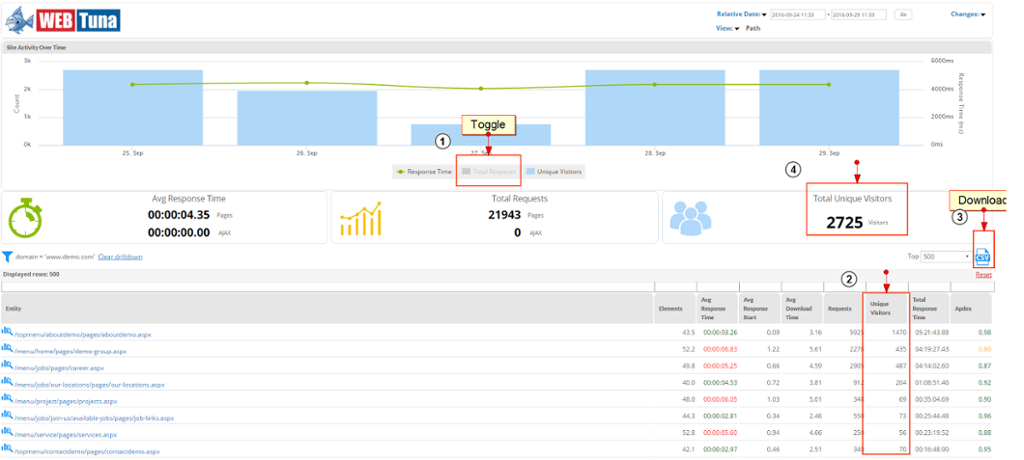
On the WebTuna Activity screen the table of results in the lower part of the screen shows the Top 500 records by default. In most circumstances this is more than enough...
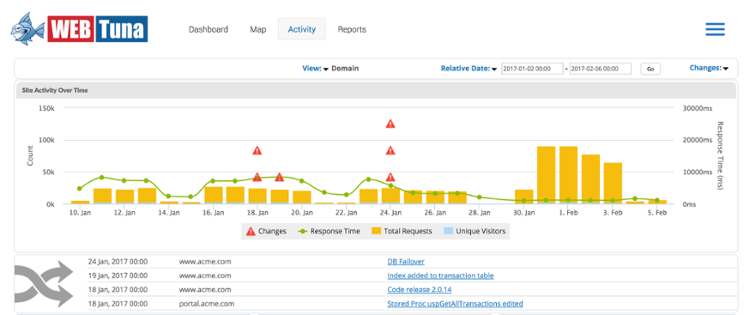
An often underutilised feature of WebTuna is the option to track changes that you make to your application or web site. These can then be displayed as annotations on the timeline view...
Following on from Mick McGuinness’ excellent article on Keeping intranet home pages lean I thought it would be interesting to see where those intranet home pages were being served from, in particular...
At the end of last year we added a new Dashboard screen to WebTuna. A few weeks ago, after feedback from customers, we removed the beta tag and released the...
In this, the second in an occasional series on performance tuning, I want to explore why caching is not a panacea even though generally it is a good idea. For...
WebTuna Software Ltd is closely related to Application Performance Ltd (it shares directors). Application Performance specialises in selling application performance monitoring (APM) products. So you would expect WebTuna to use...
WebTuna captures a rich data set for each user interaction with the web content. This data contains performance data and details of the content accessed. Viewing, capturing and reporting the...
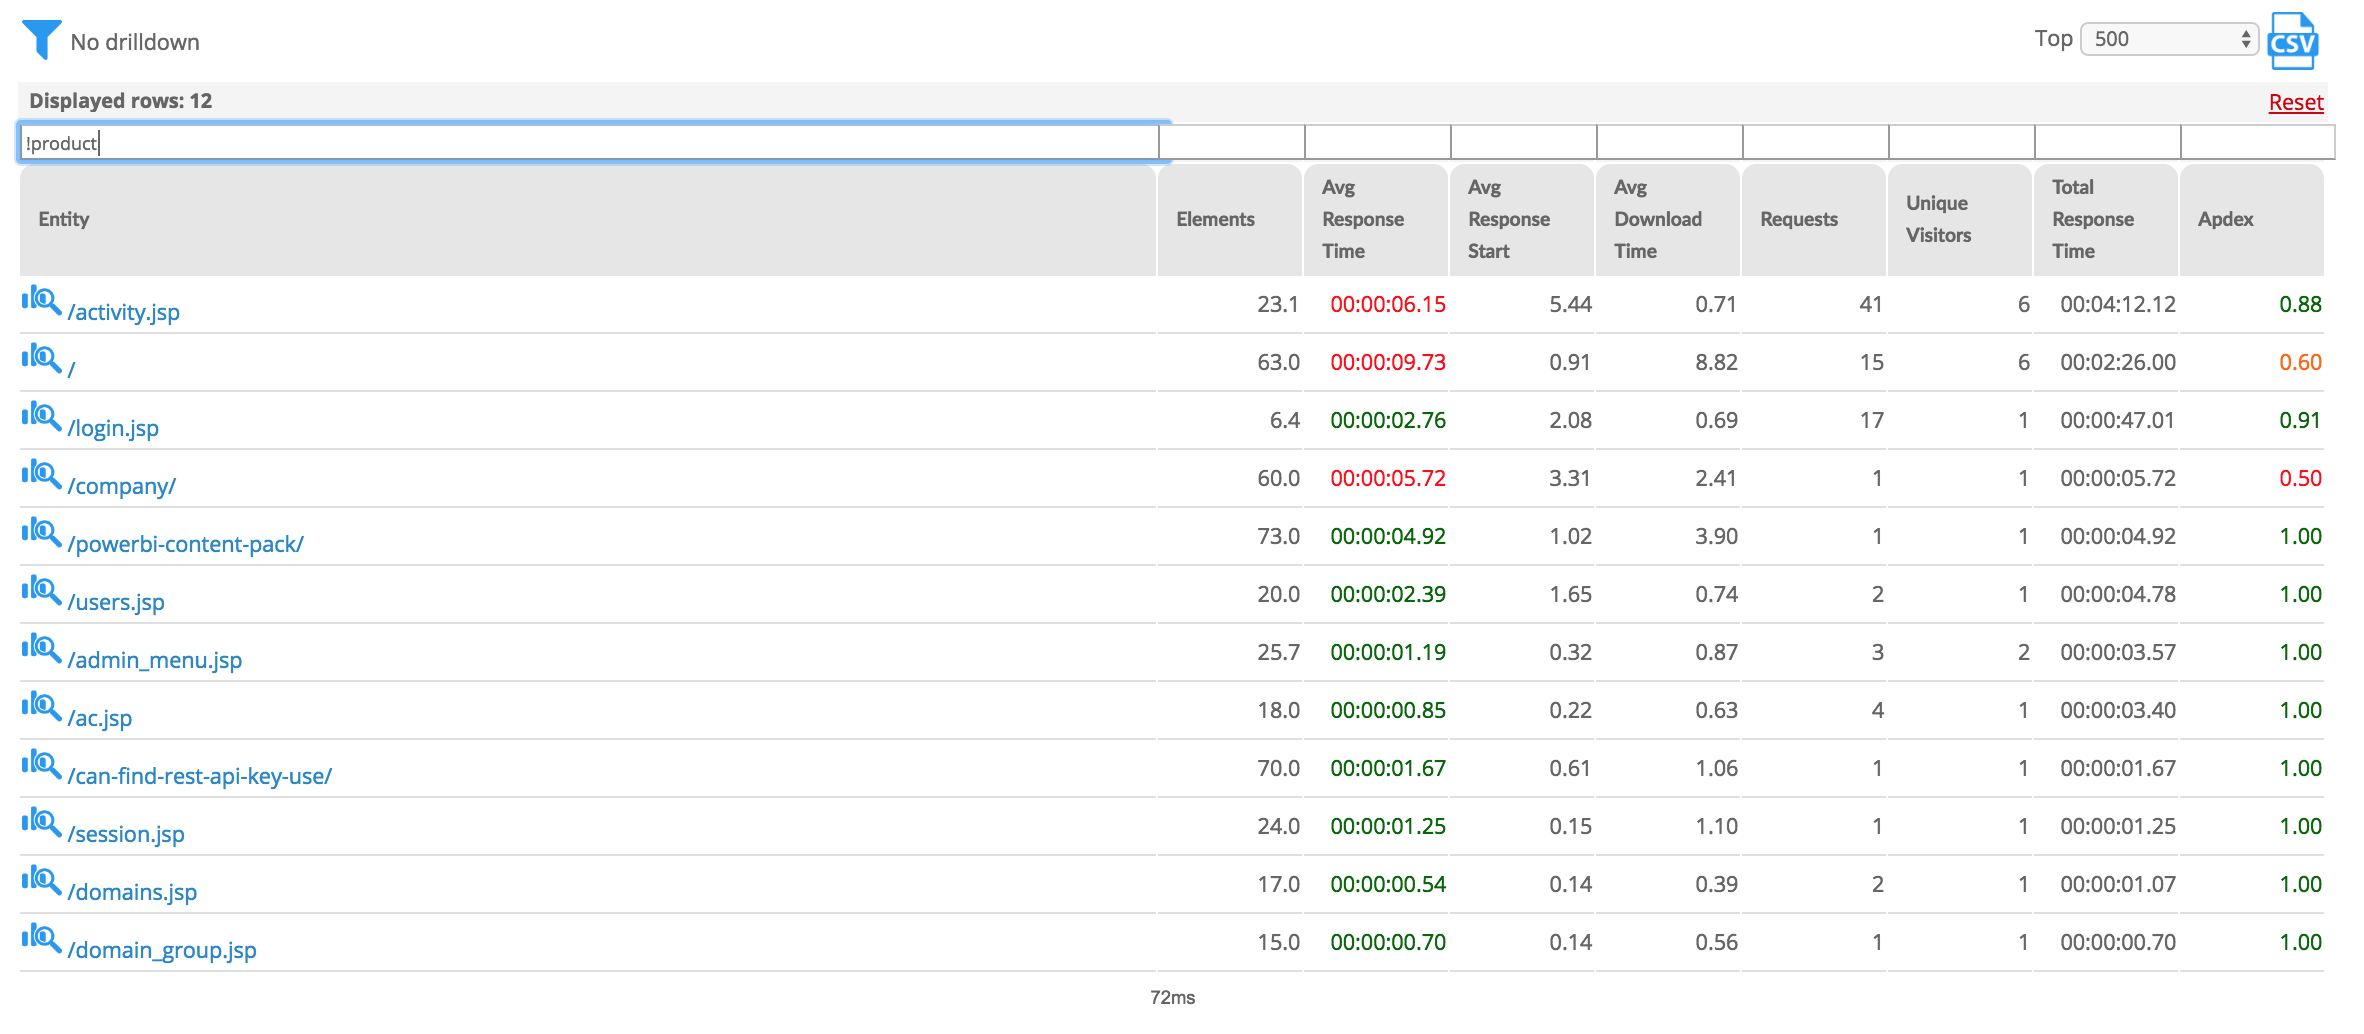
On the Performance tab within WebTuna you can filter within the results in the table of results. This filters the data within the table of results that you are looking at. As...
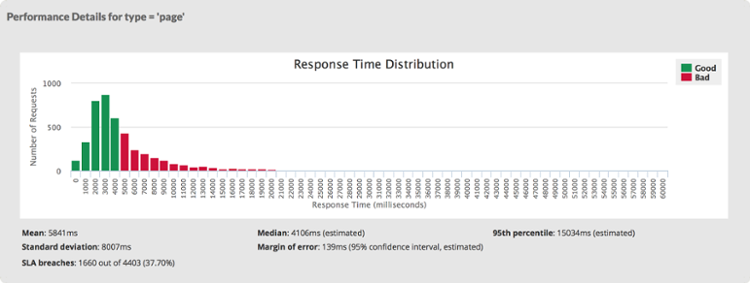
When looking at performance of a web page or website it is common to calculate the average response time. In this way you can express the performance in a single...
Apdex is a simple scoring system which is an open standard developed by an alliance of companies as a standard method for reporting and comparing the performance of applications. WebTuna...
Today we added a new session details page to WebTuna. This allows you to drill down into the page views and AJAX calls for a particular user’s session and see timings...
In this example we are going to query the WebTuna REST API to pull a metric (Average page load time) every 5 minutes and push that data to be displayed inside StatusPage.io...
The PHP code below is a simple example of how to query the WebTuna REST API to get metric data programmatically. In this example it looks at the last 300...
If the web application you are monitoring has multiple frontend web servers and you would like to see performance broken down by servername then you can have the webtuna.js capture...
We have added AJAX support to WebTuna. If your web application makes AJAX calls using jQuery 1.5 or above then they will be automatically captured by version 3 or above...
This technique is useful if you have a third party application and don’t have a master page or source code which you can edit to include the webtuna.js in the...
We hope that you liked our revamp of the geomap, which we launched about 3 weeks ago. Here’s a preview of further changes which should be released in the next...
We are are pleased to announce that WebTuna now has conversion funnel reporting. This new report is available to all customers and lets you track the number of sessions that got...
We are are pleased to announce that WebTuna now has built-in alerting for all customers who need to be notified when performance of their web site goes bad. This has...
WebTuna has a Power BI content pack to allow users to visualize and interact with WebTuna usage and performance data in new ways. It pulls detailed data daily for the previous day...
Apdex is a simple scoring system which is an open standard developed by an alliance of companies as a standard method for reporting and comparing the performance of applications. WebTuna...
Today we added a new session details page to WebTuna. This allows you to drill down into the page views and AJAX calls for a particular user’s session and see timings...
If the web application you are monitoring has multiple frontend web servers and you would like to see performance broken down by servername then you can have the webtuna.js capture...
We have added AJAX support to WebTuna. If your web application makes AJAX calls using jQuery 1.5 or above then they will be automatically captured by version 3 or above...
Do you want a quick pictorial overview of how your site is performing? The WebTuna Response Time Scatter Analysis report lets you see your site response time distributions over time.
If you have ever used WebTuna then you will know that we try to colour-code the performance data using a fairly standard red-amber-green (RAG) model. Red indicates poor performance and...
Many customers like to extract WebTuna data to further process it with Microsoft Excel. There are a number of different ways to get data out of WebTuna and into Excel...
An often underutilised feature of WebTuna is the option to track changes that you make to your application or web site. These can then be displayed as annotations on the timeline view...
When looking at performance of a web page or website it is common to calculate the average response time. In this way you can express the performance in a single...
Apdex is a simple scoring system which is an open standard developed by an alliance of companies as a standard method for reporting and comparing the performance of applications. WebTuna...
Ricardo is a global, strategic engineering and environmental agency, with more than 3000 employees, that specialises in transport, energy and scarce-resource sectors.
It has been a little while since our last release, and our new release now collects all the resource timing information that modern browsers provide. This includes images, style-sheets etc,...
When you start looking into web performance and monitoring, you are bound to come across several words and acronyms; EUM (End User Monitoring), Synthetic Monitoring and RUM (Real User Monitoring)....
It has been a little while since our last release, and our new release now collects all the resource timing information that modern browsers provide. This includes images, style-sheets etc,...
Last year we made the decision to move both our blogs (blog.applicationperformance.com and blog.webtuna.com) to a Jekyll generated static site. Static sites are in fashion right now because they are...