
At the end of last year we added a new Dashboard screen to WebTuna. A few weeks ago, after feedback from customers, we removed the beta tag and released the Dashboard to all customers and added more predefined dashboard views.
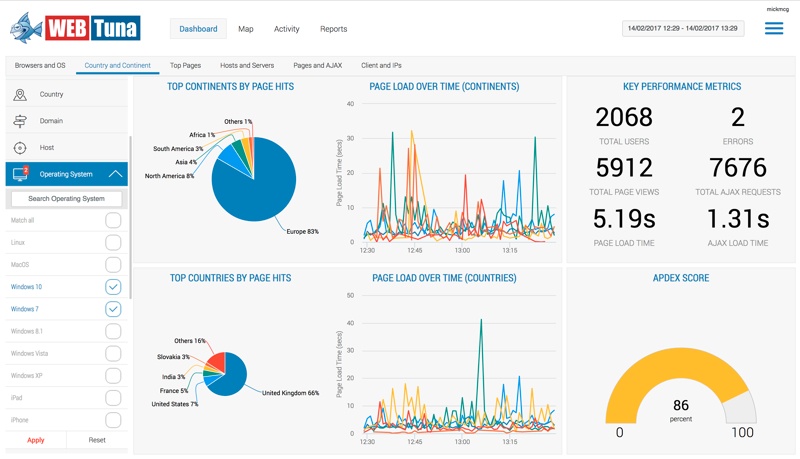
If you haven’t already seen the Dashboard screen we will take a tour of what it provides and how to use it. As you can see below there are new visualisations such as the Gauge for Apdex score and the Pie charts to show the top 5 items by Page hits. You can click into a pie chart segment to filter the corresponding line chart to the right.
Filter panel
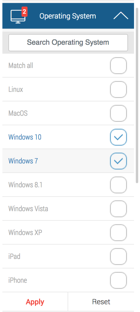
We created the filter panel so that users could filter the data based on any combination of criteria. The design resembles an ecommerce site where your list of products are refined as filters are applied. In this case as you apply your filter conditions the data displayed in all the dashboard widgets is updated. Unlike the Activity screen which lets you drill down on one thing at a time, with this new filter panel you can add as many conditions as you like on any of the dimensions that WebTuna collects. Over time we aim to add this functionality to other screens too.
Wild card matching
If you are filtering on something where there are a lot of values such as Path or Title and the one you are looking for doesn’t appear in the list then you can simply start typing in the search box and the list will filter as you type. You can also use % as a wildcard to match on a particular pattern.
Saving filters
The filters can be saved for reuse by using the icons at the top of the filter panel. The drop down allows you to pick from previously saved filters so they can be reapplied quickly without having to set them over again. That saves time if you have particular filters you use often. For example, some customers like to report on just “Supported Browsers and Operating Systems” where the filter contains just the specific Browsers and Operating systems which are approved for users to use.
Dashboard Tabs
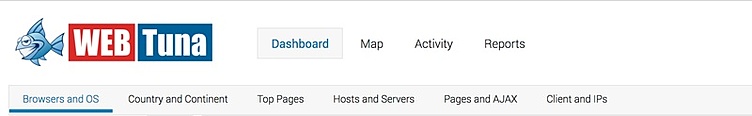
The tabs at the top allow you to switch between various dashboard views. They typically show related dimensions such as “Browser and OS” or “Country and Continent” for example.
As always if you have any feedback or comments then get in touch and we’d love to hear what you think.