
We hope that you liked our recent Conversion Funnel report, which we launched a short while ago. Here’s an overview of further changes which have just been released.
The changes take affect for all customers and let you see a histogram of converted vs unconverted sessions by response time. The funnel performance is also now based on Apdex, rather than the target page load times defined for your site.
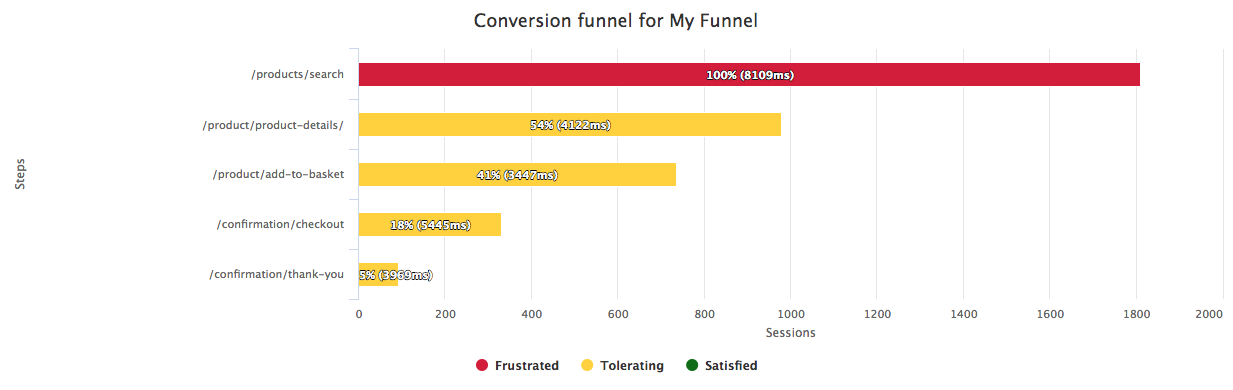
Conversion Funnel
Below is an example of a simple Sales funnel. You can see that 5% of the sessions that hit the starting page made their way to the target conversion page. The report not only shows the number of sessions that reached each of the steps in the journey but also the performance of those pages. As before, the average page load time is overlaid on the bar which is now coloured red, amber or green depending on the industry-standard Apdex score. This presents a richer view of the data than previously.
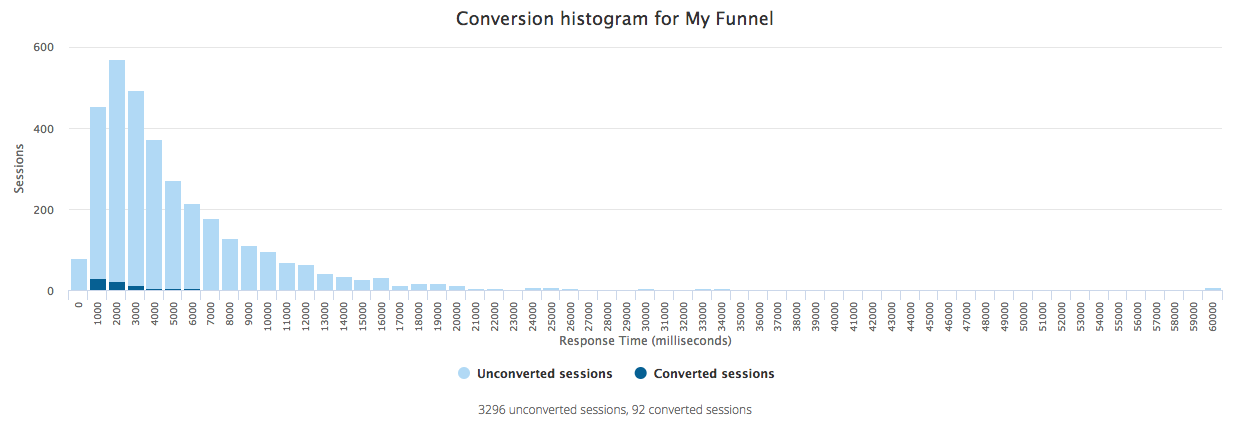
Conversion Histogram
Here is the corresponding Conversion Histogram for the above funnel. Here you can see how many sessions ‘convert’ in each of the response time bands. This allows you to weigh up the impact that degradation in performance has on the conversion rate very precisely. In the example below the dark blue bars show that the majority of sessions which converted saw average page load times of 1-3s and beyond that the conversion rate drops close to zero.
Try it Out
You can find the Conversion Funnel in the Reports section. If you need any help with this new feature please get in touch. Or if you are new to WebTuna, please signup for a 15 day free trial.