
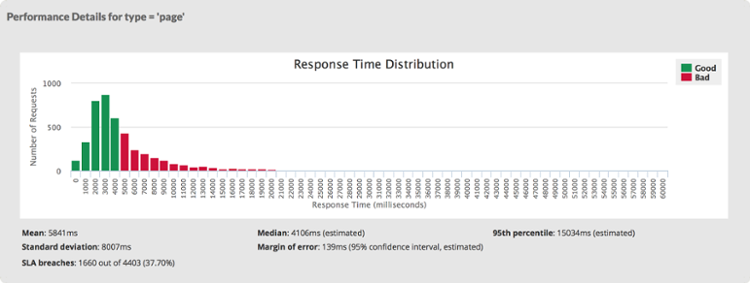
When looking at performance of a web page or website it is common to calculate the average response time. In this way you can express the performance in a single number, which is very convenient and easy to communicate. But there is some loss of information along the way – namely the spread or distribution of response times. The screenshot taken from WebTuna shows a typical response time distribution for a set of pages. So which is best: the median, the mean or the total response time?
The median (or 50th percentile or midpoint) is a good way of communicating the typical response time of a user. The median is generally unaffected by outliers i.e. those odd requests with very long response times. The median value will be close to the response time of an actual user i.e. someone will have actually experienced that response time. For a typical web page, the median is generally less than the mean. I try to use the median when talking to end users. In the example above, the median is 4.1 seconds, which is below the target of 5 seconds.
The total response time, and its closely-related friend the mean (total response time divided by the number of requests), is a good way of understanding the effort required to deliver a page. In principle, the longer it takes to deliver the page, whether it is at the browser, in the network, on the web server or in a database, the more work something is having to do. Those outliers become important because they can distort the mean quite dramatically. From a tuning point of view the total response time (and mean) is more useful. But note the mean may not actually be a value that any user has actually ever experienced. If you have a very skewed distribution of response times with perhaps some fast, cached responses together with some very slow, non-cached responses then the mean will fall somewhere in between. When talking to operations teams and developers I use the total response time (total effort time) and the mean. In the example above, the mean is 5.8 seconds, which is above the target of 5 seconds. I do of course, also include the standard deviation (or 95th percentile) as a way of describing the the distribution.